COACHELLA VALLEY 3rd QUARTER MARKET REVIEW
Year over Year Comparison
July 1 – September 30, 2022 vs 2023
Now that the 3rd Quarter is behind us, it’s time to do some comparisons. How did our local real estate market perform for the first three quarters of 2023, compared to 2022. We’re looking for developing trends.
SALES
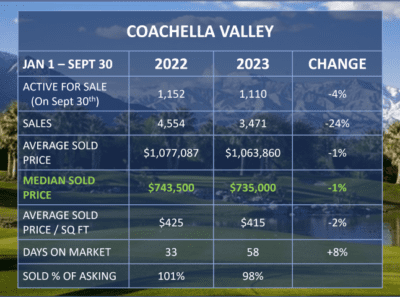
Not surprisingly, valley-wide there was a decline in the number of sales, down 24% from last year. Low inventory continues to be an over-hang on the market, in addition to higher interest rates. In a market that’s flowing, a low inventory environment would be toward a Sellers Market. Low inventory combined with rising interest rates make this market more of a mix.
PRICES
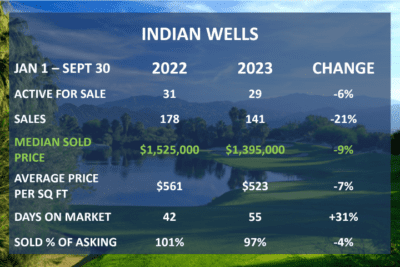
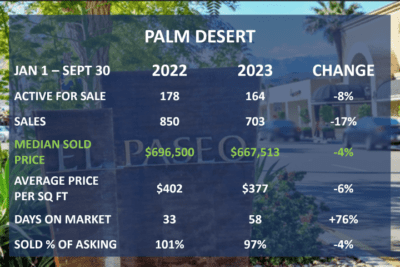
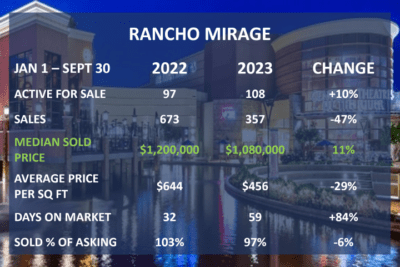
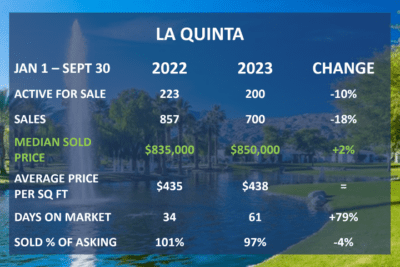
Buyers have been expecting prices to drop since the start of the FED rate increases. However, that really hasn’t been the case in the broader market – Prices are holding. The valley median selling price was down just 1% over last year. Rancho Mirage and La Quinta both had price increases, up 11% and 2% respectively. Indian Wells had the largest decline in median sale price, down 9% from last year.
INVENTORY
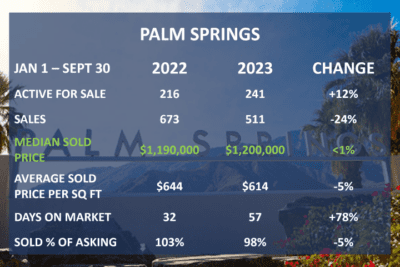
Valley wide inventory was down 4%. In our Monday Morning HotSheet, you can see Rancho Mirage and Palm Springs are the only cities with an increase in inventory from last year. Rancho Mirage had a 10% increase and Palm Springs with a 12% increase in homes on the market. A large part of our low inventory comes from Homeowners with a mortgage interest rate below 5%. Those homeowners are reluctant to sell their home to buy another at a higher interest rate, adding to the impasse we see in the markets.
TIME ON MARKET
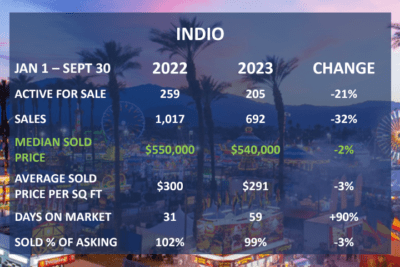
Every market across the valley saw an increase in the time it’s taking to sell. To add some perspective to this conversation; Indio had the largest increase at 90%, but it’s only taking on average 59 days to sell. The same goes for the rest of the valley, in Rancho Mirage the average time to sell is up 84% and La Quinta is up 79%, but even with the increase the time to sell is just about 60 days. Homes aren’t flying off the shelf so to speak as they were in 2021, but we still have less than one month supply of single family homes on the market.
3rd Quarter Market Comparison for Single Family Homes
3rd Quarter Market Comparison for the Luxury Market
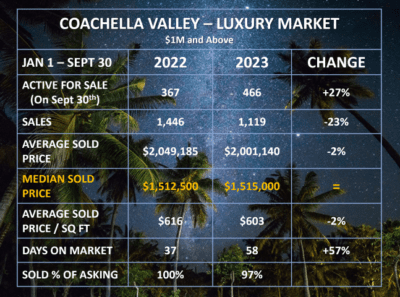
The Luxury Market, defined here as homes priced above $1M are showing a similar trend. Inventories are up, and Prices are holding. The Median Price is about the same as last year, while average price is down about 2%. Again, the price drop many home buyers have been waiting for just isn’t playing out. Nice homes are selling quickly at an average of 3% off their asking price.
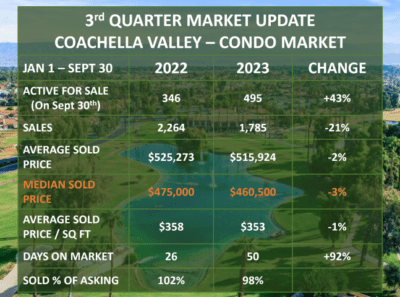
3rd Quarter Update for the Condominium Market
The attached condo market in the Coachella Valley has seen a bit of an adjustment. Inventories are up about 43% from the same time one year ago and the median sale price is down about 3%. Having said that, the condo market is strong, we have less than a 30 day supply of condo’s on the market. Add to that, Home Buyers that may have been priced out of the Single Family market, have started to look at condo’s as a possibility.
SUMMARY
Like most of the country, the Coachella Valley Real Estate Market is a mixed market and somewhat stalled. Home Sellers who don’t need to sell are sitting tight, and Home Buyers who have been impacted by rising mortgage rates are reluctant to move forward. Add to the mix, Home Buyers who have been sitting on the sidelines – waiting, thinking prices are coming down, but they haven’t in any meaningful amount. Put that all together we have a bit of a stand-off so to speak.
Who blinks first remains to be known. Season is just ramping up, so we’ll start to see more inventory enter the market as we move into and through our season.
The FED pause is helpful to the psyche of the markets, but rates today are sitting at 6.875% (7.02 APR) with 1 point. When we bought our first condo in 1984 with a 13% mortgage rate, we felt lucky, the rates had just come down from 14.8%. As time goes on, both home buyers and home sellers will need to move on and work with the market as it is and the market will begin to flow more freely.
How did each city perform in the 3rd Quarter? Check out the charts below
RESOURCES
FOR HOME SELLERS
We prepared this Desert Home Seller Guide to help. As you think about selling your home, you’ll want to know what to focus on for the highest ROI. How can you make your home more marketable and what questions should you be asking, along with information about pricing and staging. You’ll also need to know the current value of your home in this market. What’s My Home Worth in this Market? We’re happy to provide a professional home valuation to help with your decision process.
FOR HOME BUYERS
What does that Desert Dream Home look like for you? Is it a Fairway home in a Private Club, or is it a single family home without HOA’s and close to dining and entertainment? Perhaps you’re not quite ready to retire and want a second home as a family get away that you could rent when you’re not using it, for income to offset the expense of ownership. No matter what you’re thinking about for your Desert Dream Home, we can help. We understand the nuance of each community and have a deep understanding of this market. We prepared this guide for you Desert Home Buyer Guide to help.
No matter if you’re a Home Seller or Home Buyer in the Desert market, who you work with matters. We’re on stand by to help, give us a ring today.

(760) 218 – 5752